
Improve customer GPU economics without doubling support
Show customers where paid capacity stops producing work, separate job faults from infrastructure faults, and shorten every escalation.
See the neocloud use caseRidgeScope finds where allocated GPUs stop producing useful work — idle jobs, hangs, stragglers, data starvation, checkpoint I/O, fabric bottlenecks, and runs that finish without learning. Then it shows what the evidence supports and the next action.
Every GPU, every training run, and the estimated cost of non-productive time in one view. Open any slow or wasteful run to see why.
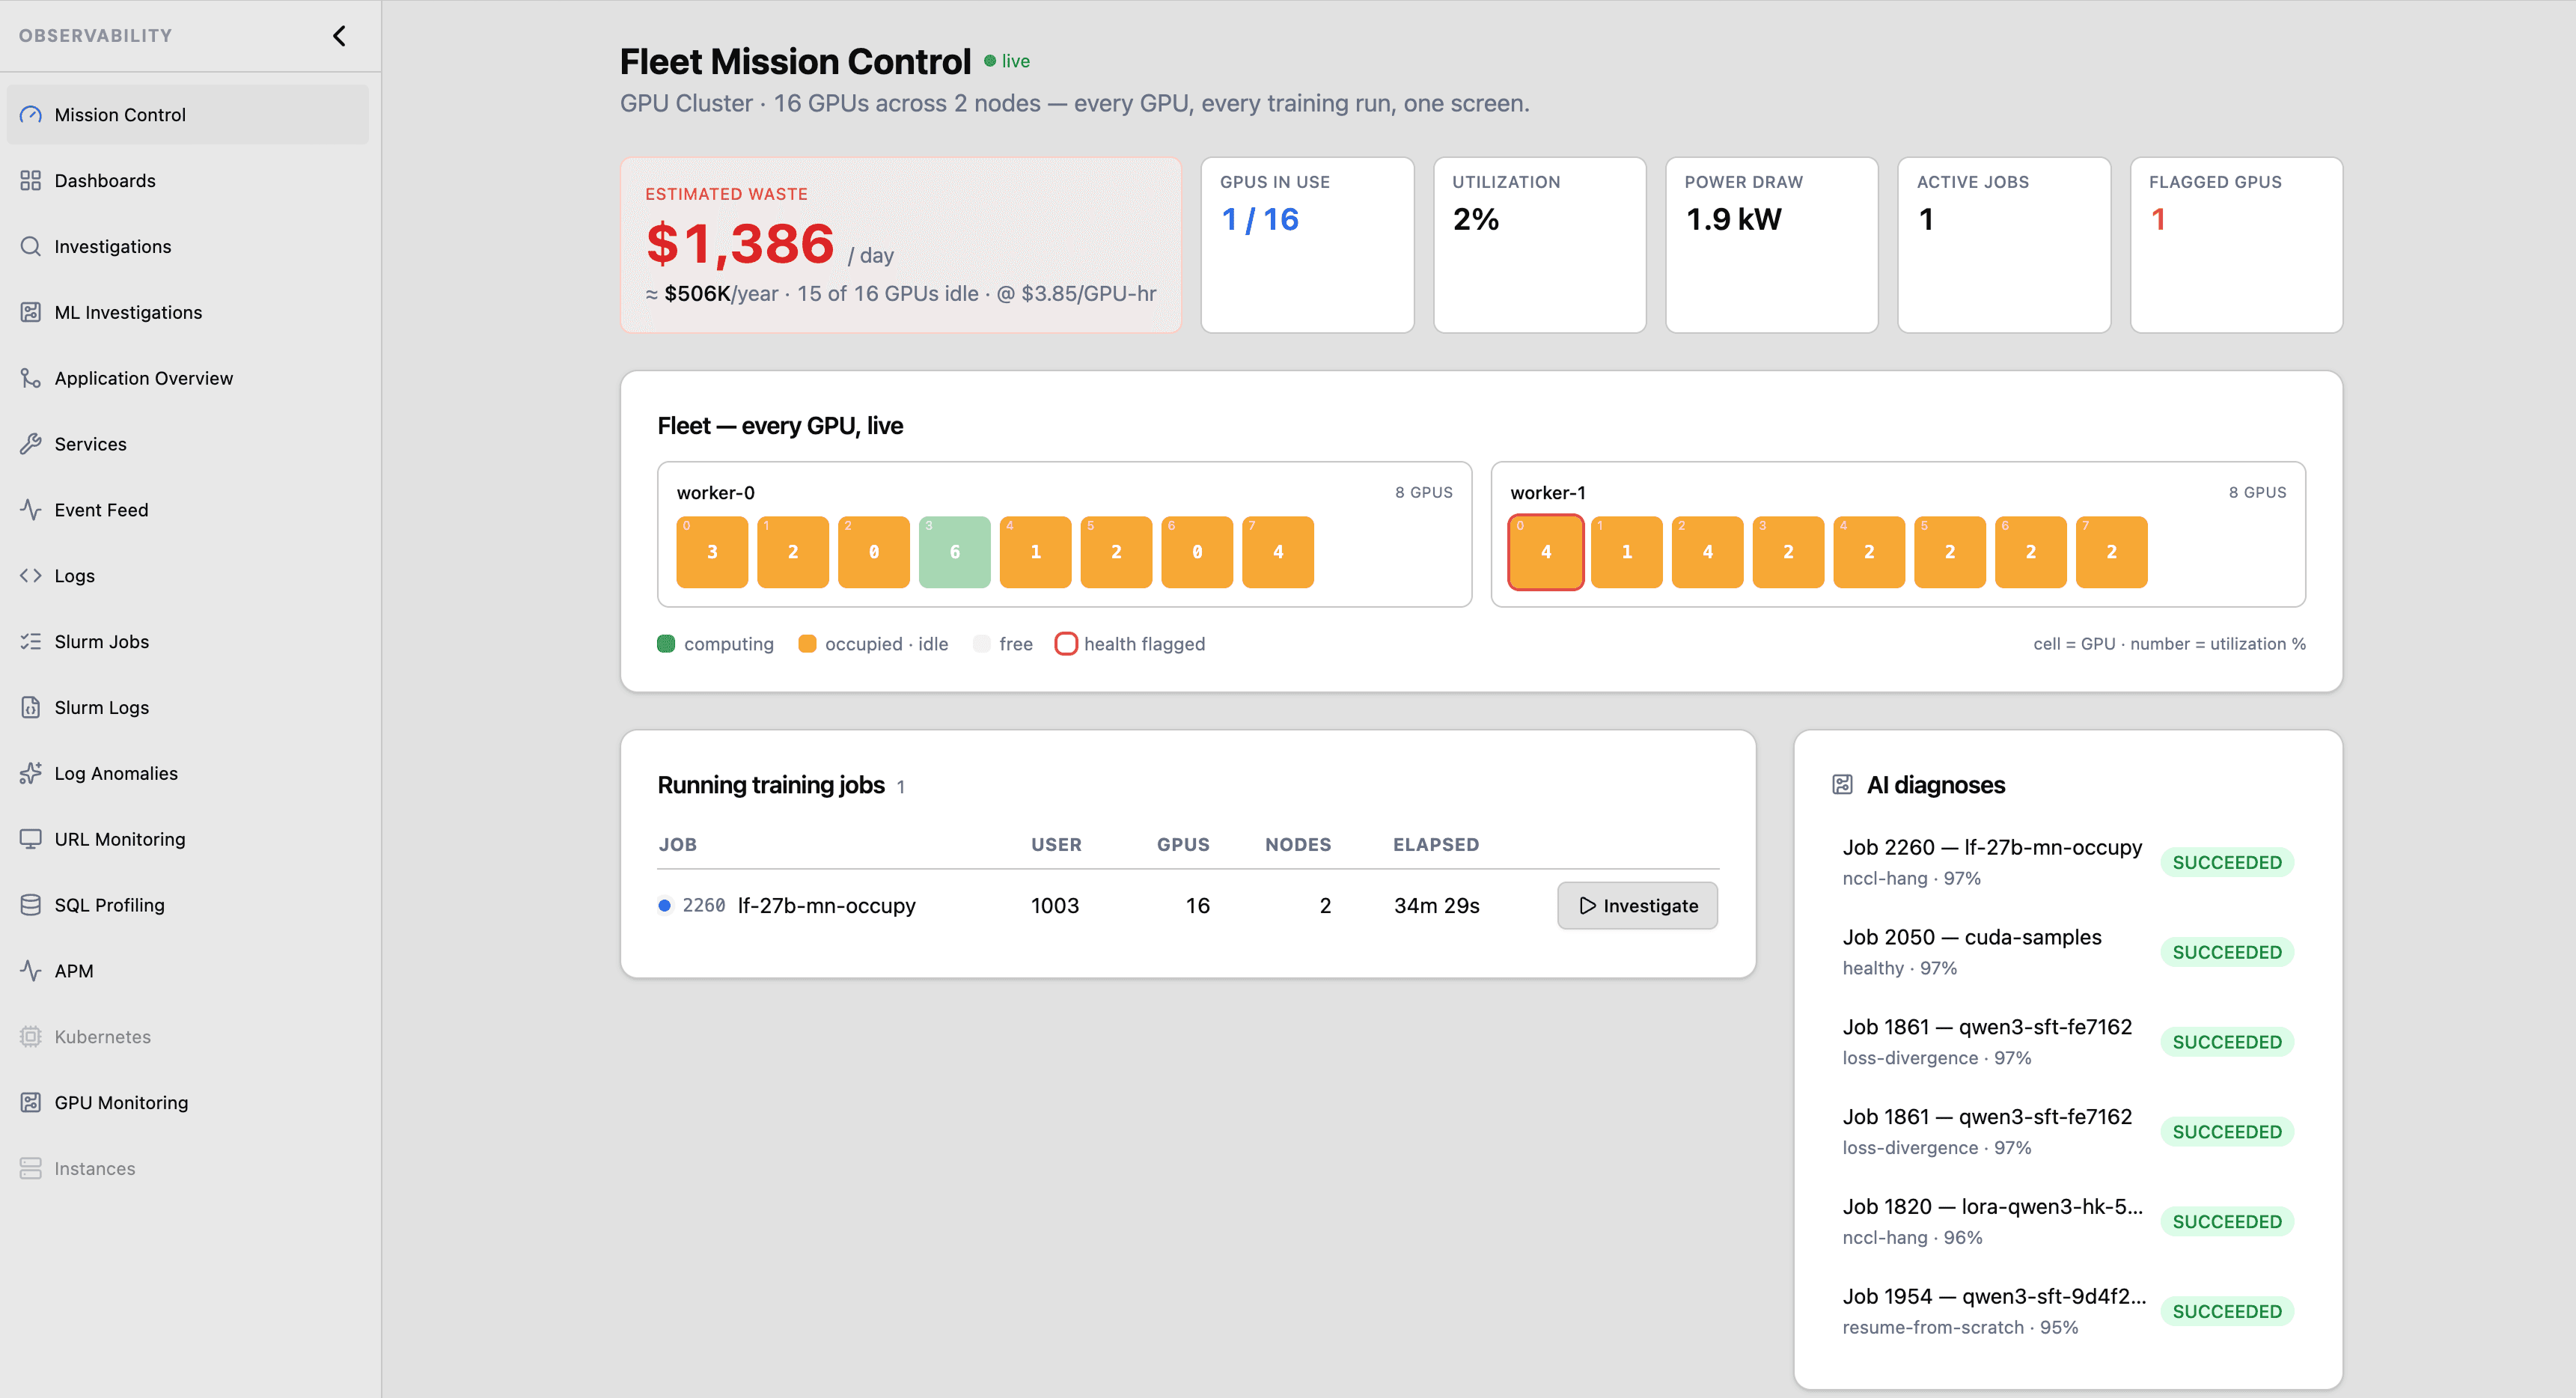
RidgeScope measures whether allocated GPUs are doing useful model work and whether the training run is advancing toward its intended outcome.
The job holds expensive GPUs while waiting on a launcher, dataloader, deadlock, or empty workload.
Engine activity looks high while ranks spin in NCCL, wait on a straggler, or serialize kernel launches.
The scheduler reports success, but the model did not learn, resumed from scratch, or barely trained.
Commercial occupancy answers whether capacity is sold. RidgeScope answers whether the capacity already allocated to training is producing useful work — and why it is not.
Use a current neocloud H100 reference or enter your contracted rate. Replace the default waste percentage with what RidgeScope measures in your own fleet.
128 GPUs × 24h × $3.85/h × 25% non-productive time
H100 references checked July 14, 2026. Nebius: $3.85/GPU-hour · CoreWeave: $49.24/hour for 8× HGX H100
This estimates cost exposure, not guaranteed savings. RidgeScope measures where allocated time is idle, stalled, waiting, or otherwise not producing useful training work.
Standard managed coverage starts at $40 per covered GPU per month ($0.055 per covered GPU-hour). The effective rate steps down with fleet size, every core feature is included, and larger fleets use custom agreements.
Equivalent rate for committed fleet coverage. Fleets above 128 GPUs use a custom site or OEM agreement.
These cases come from the product's labeled training-run evaluation corpus. Each verdict is grounded in the telemetry available to the deployed agent.
Memory stayed resident while the job made no GPU progress and printed no useful error.
A debug flag created long launch gaps even though the training continued and eventually completed.
Fifteen GPUs repeatedly waited on one slow rank while aggregate cluster metrics looked normal.
The model learned, but near-continuous checkpointing collapsed useful SM activity.
Collectives advanced slowly while GPUs spent most of their time busy-waiting instead of computing.
The run completed cleanly, hardware stayed healthy, and the loss trajectory showed a wasted allocation.
Detection coverage is validated against 27 labeled healthy and failure cases. It is not a claim of universal production accuracy.
Show customers where paid capacity stops producing work, separate job faults from infrastructure faults, and shorten every escalation.
See the neocloud use caseCatch idle jobs, bottlenecks, hangs, and completed-but-bad runs before they consume another allocation.
See the AI lab use caseA lightweight on-node agent correlates the GPU, runtime, training log, and scheduler — no SDK, no code changes, no special logging sink.
Memory & allocation curves, engine-active vs SM-active duty cycle, XID / ECC / thermal health.
Kernel launch counts, API durations, in-flight collectives — separation of idle hang from real compute.
Loss trajectory, framework progress, Python tracebacks — attributed by rank, node, and process.
Job & step lifecycle, per-node epilogue/prolog exit codes — encode failure isn't read as a code fault.
GPU engine activity is never trusted alone. RidgeScope corroborates SM work, kernel launches, collective progress, rank behavior, and the training trajectory before it calls a run productive.
Every signal the verdict is allowed to cite, in one public catalog — browse the Evidence Index
RidgeScope is designed for environments where job output, model behavior, and cluster telemetry are proprietary. Choose a managed or private deployment so you control where telemetry is stored and where investigations run.
Each organization receives separate data stores, organization-scoped application access, and write-only ingestion credentials.
Signed organization identity is verified across the API, live connections, provisioning, and secrets boundaries.
Vault mediates access to data services so applications use organization-scoped credentials instead of shared database passwords.
Data is encrypted in transit and at rest. Data stores, secrets, and telemetry services remain on private networks.
Keep the operational simplicity of a managed service or place the full data and investigation path inside your own environment.
Discuss a private deploymentPrivate data services, organization-scoped access, and encrypted storage without another platform for your team to operate.
Keep telemetry, secrets management, and investigation inference inside your security boundary.
“Job 2260 is currently hung inside an NCCL collective and will not recover without intervention.”
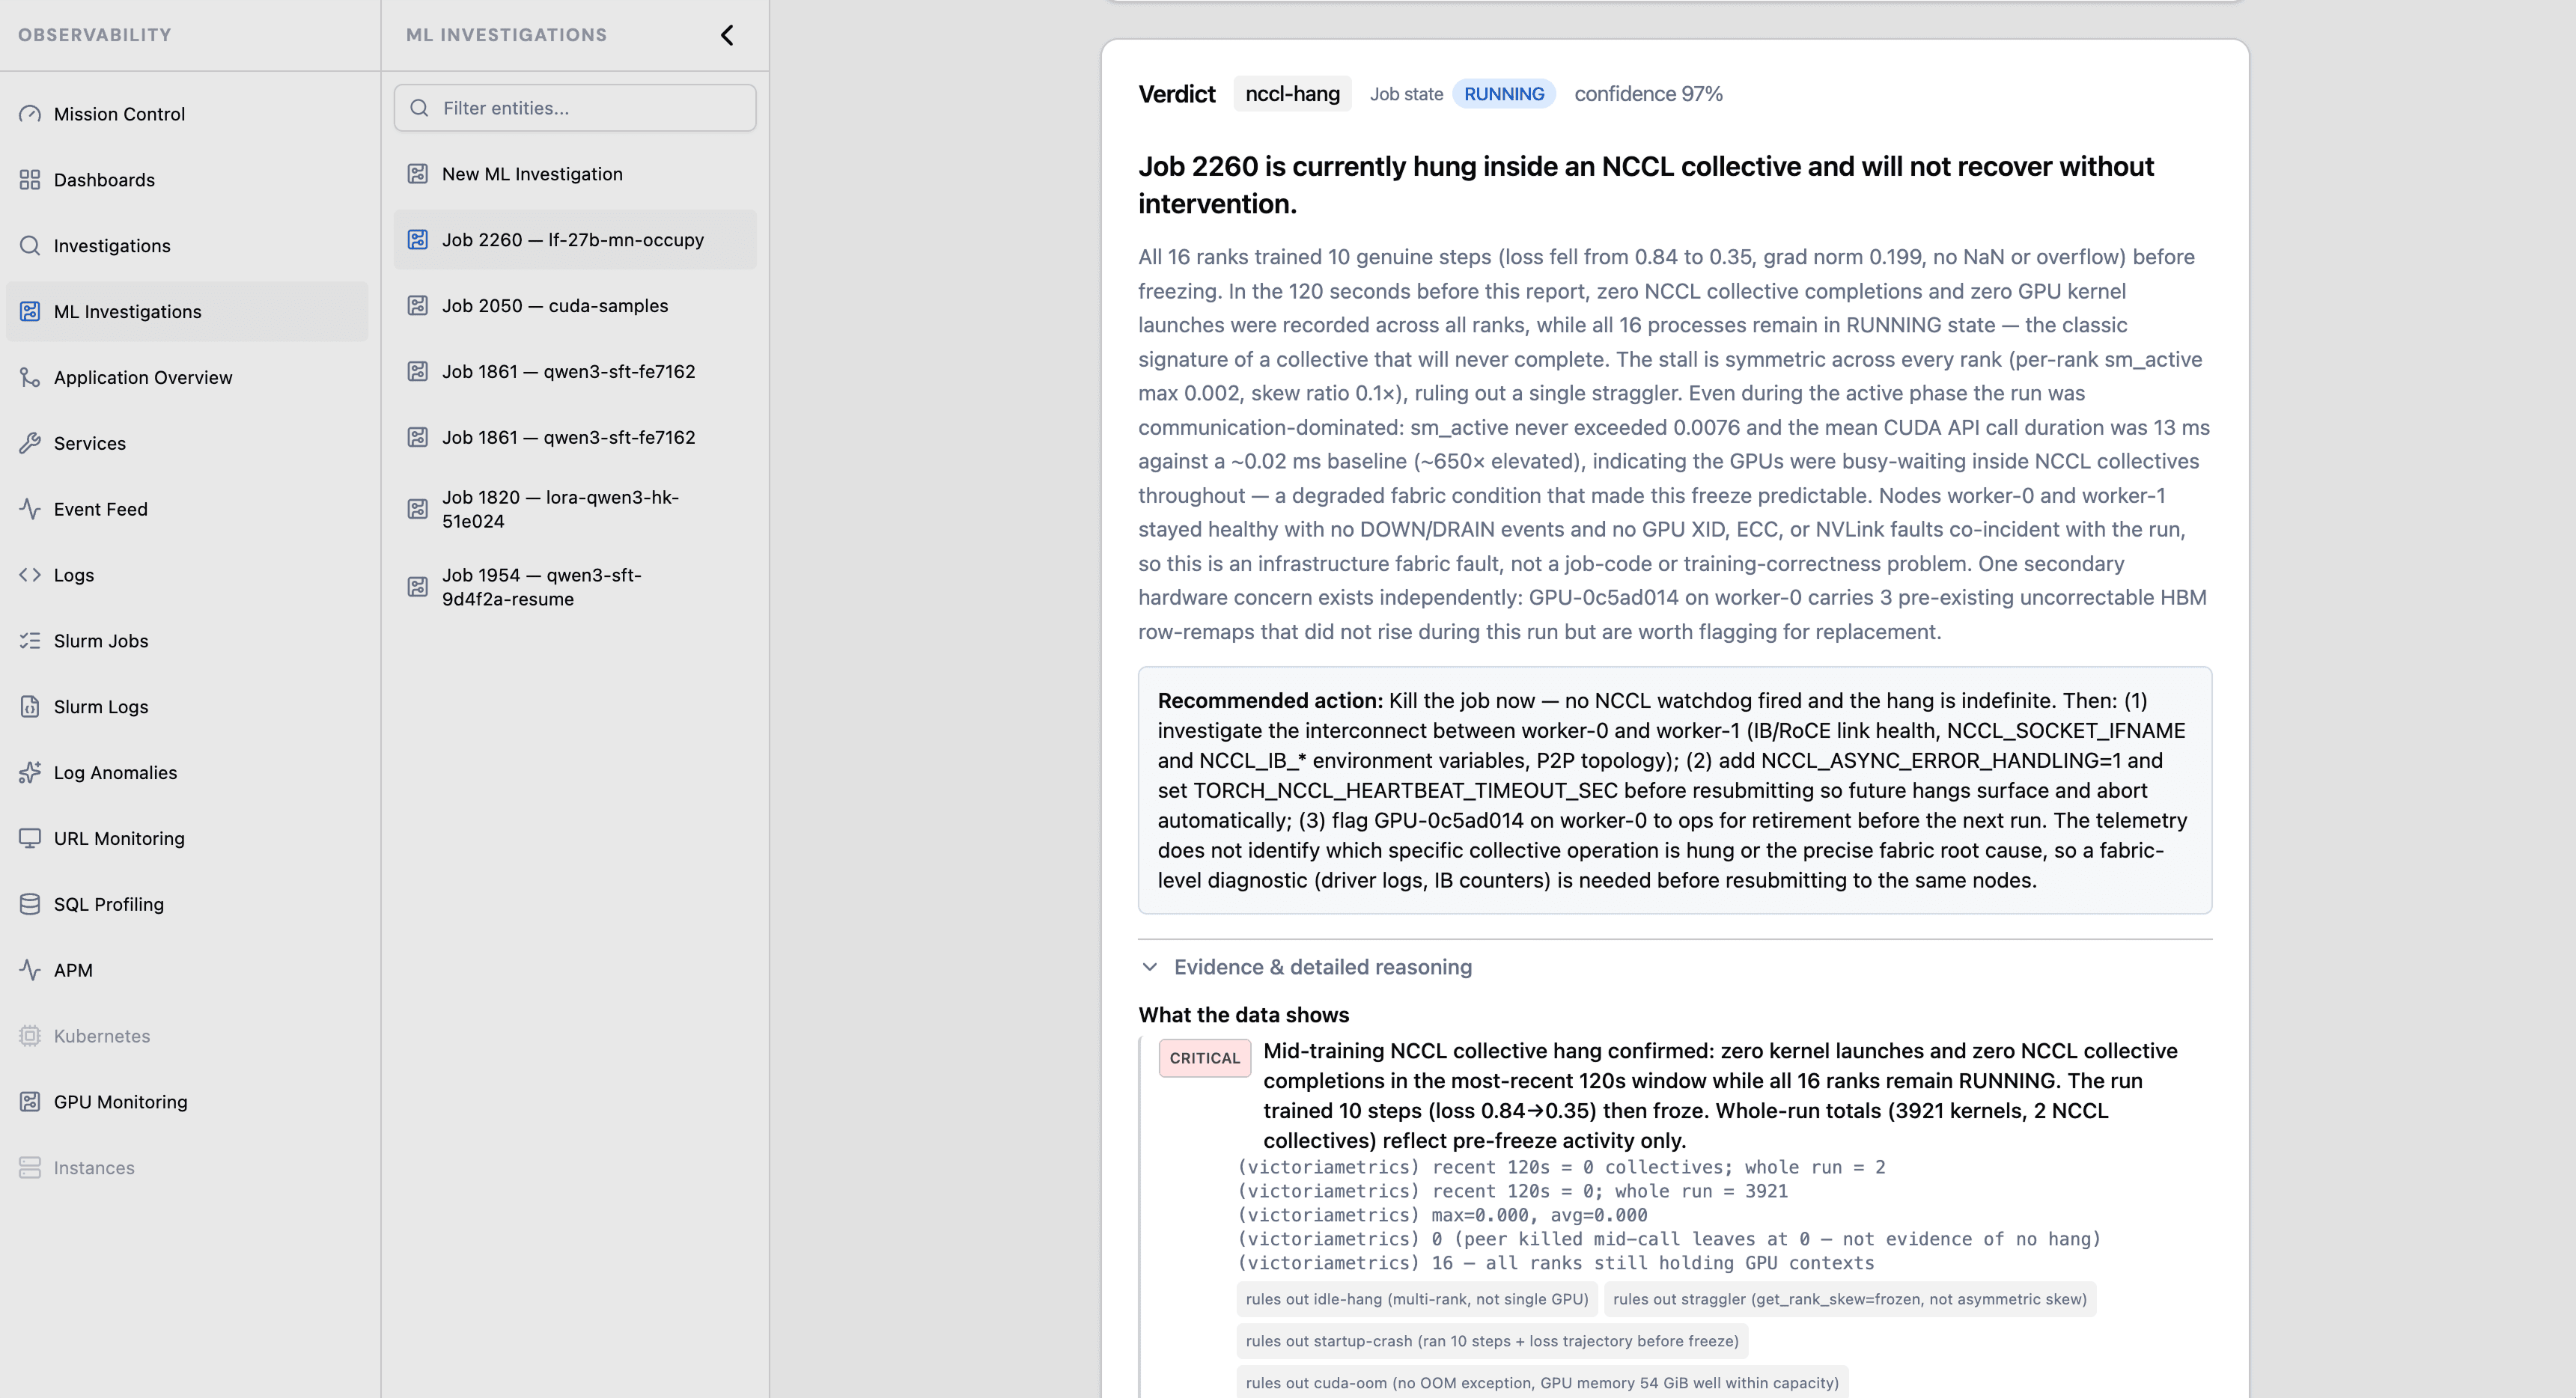
Every investigation ends in a three-part verdict — what the data shows, what it implies, and how to confirm the cause — plus a single failure family and a confidence score. Here is a real “done-but-bad” case: the run that succeeded and learned nothing.
The run completed cleanly and the GPUs were healthy — but the loss rose, then dead-plateaued near 11.9, with the gradient norm trending to zero. Every infrastructure tool read “healthy” until the loss was read.
Loss divergence — a training-correctness failure, not an infrastructure one. The whole allocation produced a model that learned nothing, and because it completed cleanly, nothing else flagged it. The tell is the shape of the loss.
Inspect the learning-rate schedule, precision and overflow settings, and dataset/label validation around the divergence window. Those checks distinguish optimizer, numerical, and data-quality causes.
The third part turns uncertainty into an action: it names the next evidence needed to confirm the cause.
RidgeScope catches idle and slow runs, infrastructure failures, distributed coordination problems, and “done-but-bad” training that completes cleanly while producing no useful model.
GPU under-utilization, I/O save-storms, stragglers — one slow rank drags the whole multi-GPU allocation.
Loss divergence, silent resume-from-scratch (checkpoint never loaded), underestimated runs.
Node-down mid-run, requeue / preemption, timeout — a job fault vs. an infrastructure event.
Confirms a genuinely healthy run on positive evidence, not on the absence of errors.
+ 3 more families covered (Startup & config · GPU memory & hardware · Distributed coordination) — every mode is named and ruled in or out with counterfactuals.
Browse the full failure catalog
Infrastructure tools tell you that a GPU is allocated or active. RidgeScope reads the run — from the loss trajectory to per-rank collectives — and explains whether that activity is producing useful training work.
| Capability | RidgeScope | Datadog GPU | DCGM + Grafana | NVIDIA Mission Control |
|---|---|---|---|---|
| GPU telemetry (utilization, ECC, thermals) | ✓ | ✓ | ✓ | ✓ |
| Reads the loss trajectory from job output | ✓ | − | − | − |
| Per-rank CUDA & NCCL tracing — no SDK, no code changes | ✓ | − | − | − |
| Detects “done-but-bad” runs (completed cleanly, learned nothing) | ✓ | − | − | − |
| Plain-English root-cause verdict with cited evidence | ✓ | − | − | − |
| Separates a job fault from an infrastructure fault, per run | ✓ | − | − | − |
| Shows how to confirm the cause when evidence is incomplete | ✓ | − | − | − |
Based on publicly documented capabilities of each product, July 2026.
The agent reads loss, gradient norm, learning rate, and checkpoints directly from each job's standard output, via a registry of framework-specific parsers.
Full ecosystem incl. the fine-tuning & alignment stack.
Full ecosystem incl. large-scale tensor and pipeline-parallel workloads.
Full trainer lifecycle, step- and epoch-level telemetry parsing.
Callback-level and fit-loop telemetry for TF2 and Keras training runs.
Coverage comes from parsers, not from SDKs the team has to install.
PCI DSS & GDPR · On-prem / air-gapped · SSO / SAML · Per-tenant isolation · Local LLMs — telemetry never leaves your environment
A GPU is productive when it is doing useful model work and the training run is advancing. RidgeScope combines SM activity, kernel launches, collective progress, rank behavior, step progress, and the loss trajectory. It does not equate an allocated GPU—or even high engine activity—with useful compute.
They read infrastructure health and hand you dashboards and a query language. RidgeScope correlates the training itself — the loss trajectory, per-rank CUDA/NCCL activity, scheduler records — and explains where GPU time stopped being productive. A run can be allocated, busy, and still waste compute; RidgeScope identifies why.
No. A lightweight on-node agent collects everything — GPU telemetry, eBPF-level CUDA/NCCL traces, job stdout, Slurm records. No SDK, no code changes, no special logging sink, no access to your training code required.
The agent installs in minutes across a Slurm-scheduled cluster. The first cited investigation lands within 30 minutes, and Mission Control begins showing which allocations are computing, waiting, idle, or unhealthy.
Yes. On-premise and air-gapped deployments are supported, with local LLMs so telemetry never leaves your environment. PCI DSS & GDPR, SSO/SAML, encryption at rest and in transit, and strict per-tenant isolation.
Hugging Face Transformers (including TRL, LLaMA-Factory, Axolotl), Megatron-LM, PyTorch Lightning, and Keras/TensorFlow — via a registry of framework-specific parsers, not SDKs. For fully custom training loops, RidgeScope reports the infrastructure evidence and identifies the additional progress signal needed to confirm learning.
RidgeScope does not guess when evidence is incomplete. It shows what is proven, what is ruled out, and the next evidence needed to confirm the cause.
Get a free audit of your current GPU utilization. We'll identify wasted capacity and the clearest opportunities to improve it.